Table of Contents
What is the Fishbone Diagram | Cause and effect diagram?
Fishbone diagram is a graphical tool used for organizing potential causes of a problem in a logical manner. The fishbone diagram identifies many possible causes for an effect or problem.
It can be used to structure a brainstorming session. It immediately sorts ideas into useful categories. It is mostly used in conjunction with other problem-solving techniques, such as 5 Why root cause analysis.
It is called a fishbone diagram because of its shape. Its shape looks like a fishbone and hence the name fishbone diagram.

This tool was popularized by Dr. Kaoru Ishikawa, hence this tool is also known as the Ishikawa diagram.
I have seen many professionals confusing cause and effect diagrams for cause and defect matrices, but in reality, these two are quite different.
The Cause and Effect Diagram or fishbone diagram is the identification and pictorial representation of many possible causes for an effect or problem. It can be used to categorize various causes under different heads based on Brainstorming session inputs. Whereas the cause-and-effect matrix (C&E matrix for short) helps you prioritize Process inputs(X’s) based on the impact they have on Process outputs or Key Process input variables(Y’s).
The Cause and Effect Diagram has six branches called 6M’s. These are Man, Machine, Material, Method, Measurement, and Mother Nature.
The Cause and Effect Diagram is one of the 7 QC tools. Following are the other 7 QC Tools
- Checksheet
- Pareto Chart
- Scatter Diagram
- Histogram
- Stratification
- Control Charts
When do we use a Fishbone Diagram?
The Fishbone Diagram can be used in any situation where you want to identify the cause of something. Some common situations where you might use a Fishbone Diagram are:
- Quality Control Problems
- Customer complaints
- Problems with production
- To use in conjunction with other 7 QC tools.
- To uncover bottlenecks and identify issue where and why a process doesn’t work
- For Project Planning
How to Create a Fishbone Diagram?
The following steps can be used to make a Fishbone diagram:
Step #1
Draw a diagram of a fish skeleton on a piece of paper.

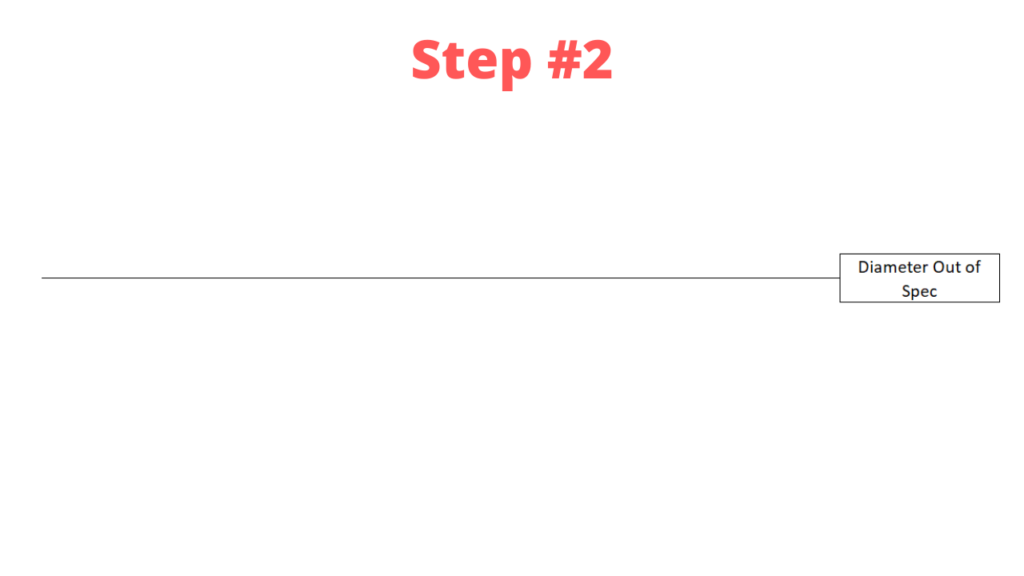
Step #2
Label the head of the fish with the problem or effect that is being investigated.
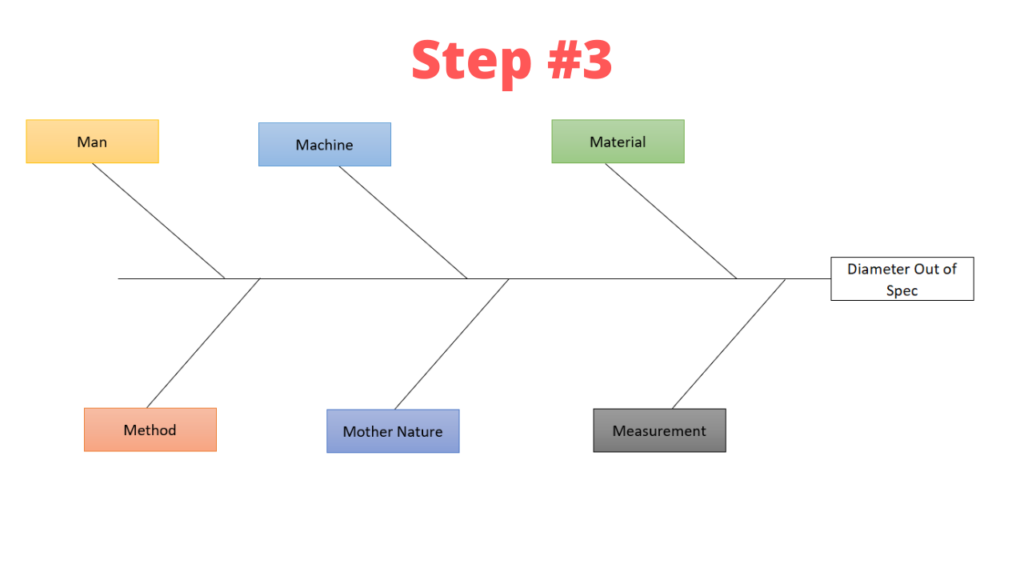
Step #3
Label the spine of the fish with the categories of potential causes. These categories can be based on knowledge of the problem, brainstorming, or previous Ishikawa diagrams.
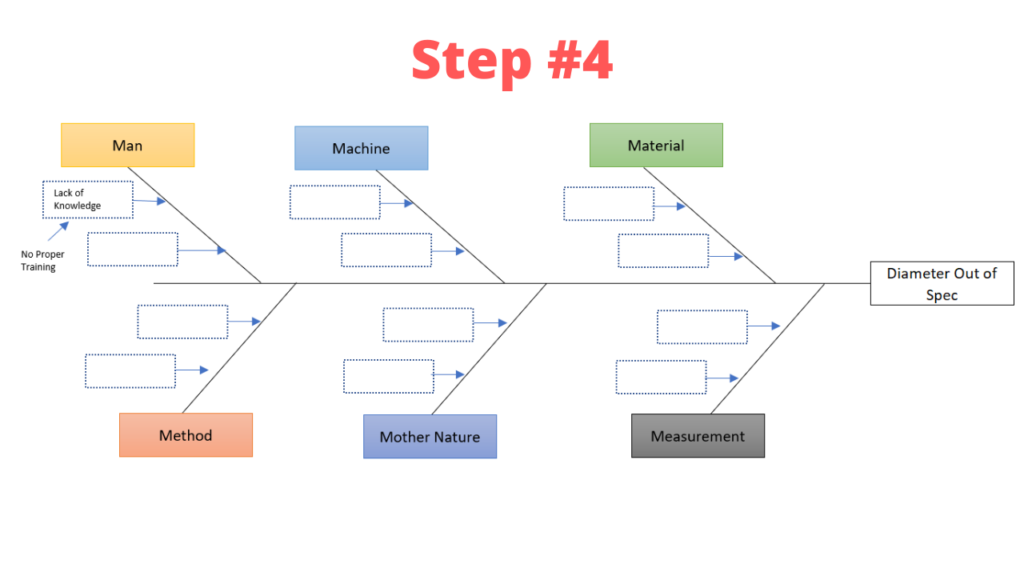
Step #4
Brainstorm the potential causes of the problem or effect and write them on the appropriate bones of the fish skeleton.
Step #5
Once all of the potential causes have been identified, analyze them to determine which are the most likely causes.
Fishbone Diagram and Six Sigma
Ishikawa or Fishbone diagrams are a valuable tool for any Six Sigma project.
Fishbone diagrams are used to identify the root causes of a problem in the “Analyze” phase of Six Sigma’s DMAIC (Define, Measure, Analyze, Improve, and Control).
The Analyze Phase is the third phase of Six Sigma’s DMAIC.
This is the phase where the statistical study of an issue begins. The Define phase describes the problem while the Measure phase collects data and uses it to measure performance. In this stage, project owners use statistical evaluations of abnormality or variation in order to determine which components are major contributors to output. The focal point of this phase is to identify and analyze the root cause/s of imperfection.
This phase consists of several steps which also require several tools. Fishbone Diagram is one of the most important tools used in this phase.
Example: ABC is a valve manufacturing unit receiving persistent customer complaints about the shaft diameter. The Plant manager asked QA and Production team to conduct a root cause analysis. So, the team performed Brainstorming and draw the Cause and Effect diagram to identify all the possible causes.
The team identified the wrong caliper and wrong procedures are the probable causes. Further, the team has to perform a 5Why analysis to identify the root cause for these probable causes.
How Fishbone Diagram helps in Problem solving?
The fishbone diagram, also known as the Ishikawa diagram, is a problem-solving tool that can be used to help identify the root causes of issues or problems. The diagram is often used to help structure problem-solving efforts by prompting users to consider a wide range of potential causes for a problem.
The fishbone diagram is constructed by dividing a piece of paper into six sections, and then drawing a fish skeleton in the middle of the paper. The fish’s spine represents the problem, while the ribs represent potential causes of the problem. Users can then brainstorm ideas for each rib, noting any relevant information in the corresponding section of the diagram.
Once the brainstorming session is complete, the fishbone diagram can be used to help identify potential root causes of the problem. The diagram can also be used to help develop potential solutions to the problem. A fishbone diagram is a versatile tool that can be used in a wide variety of problem-solving contexts.
Fishbone Diagram in Project Management
The Fishbone diagram is used in Program Management to identify the cause and effect of project activities. The diagram is sorted into categories that vary depending on the type of project. This allows for a more complex brainstorming session, which can lead to a more efficient project.
There are several ways to use a Fishbone diagram from project management.
The most common way is to brainstorm the activities of the project and place them into categories. This can help identify potential causes and effects that may not have been considered before.
Another way to use the Fishbone diagram is as a problem-solving tool. If there is an issue with the project, it can be used to help find the root cause of the problem.
Finally, the Fishbone diagram can also be used as a communication tool. By displaying the categories and their corresponding causes and effects, team members can better understand the project.
What are the advantages and disadvantages of Fishbone Diagram?
Fishbone diagrams, also known as Ishikawa diagrams, are used to help identify possible causes of problems or issues. They can be used in a variety of settings, from business and manufacturing to healthcare and academia.
There are a number of advantages to using fishbone diagrams:
- They help to identify the root causes of problems.
- They are an effective way of organizing and visualizing data.
- They can be used to generate hypotheses about problems.
- Help prioritize relevant causes, so underlying root causes are addressed first.
Overall, fishbone diagrams can be a helpful tool for identifying the causes of problems. However, they should be used carefully, as they have some potential drawbacks.
- They can be time-consuming to create.
- They may not be effective in all situations.
- They can be difficult to interpret if they are not well-designed.
- Fishbone diagrams can be used in a divergent approach; the temptation to identify and correct everything that might be contributing to the problem is strong. Because few teams have the resources to fix every potential source, this generally results in little success. If you do a fishbone diagram and it has 30 potential sources, it’s likely that your team will feel overwhelmed by the problem.
Role of Fishbone Diagram in Quality Control
Fishbone diagrams are used in quality control to identify and troubleshoot potential causes of defects or problems. The diagram is formed by linking potential causes of a problem to its effects, with the goal of identifying the root cause of the problem. This can then be addressed to prevent the problem from recurring.
It is particularly useful in industries where quality is critical, such as manufacturing and healthcare. It can be used to help identify and prevent problems such as product defects, missed deadlines, or patient injuries.
The diagram can be tailored to the specific needs of a business or organization. For example, it can be used to investigate problems with a specific product or process. It can also be used to brainstorm potential causes of a problem.
Download Free Template
References
sixsigmastudyguide.com
asq.org
www.whatissixsigma.net


