Table of Contents
Definition
SPC stands for statistical process control. SPC is the use of statistical methods or SPC tools to measure, collect and analyze data to improve and control any manufacturing process or method for desired process output.
But to understand this term in a much deeper manner, we need to break the term into three parts :
Statistical
It signifies that SPC is a statistical study. That means we are dealing with sample size, not the complete population. Since collecting data for the complete population is a lengthy, time-consuming, expensive, and impractical task.
Process
It converts input resources into the desired output (goods or services) with a combination of people, materials, methods, machines, and measurements. Here it signifies that we are dealing with a production process, so we are collecting data related to a particular process.
Control
It includes crafting systems and procedures to keep our process output in the desired state. It signifies that in SPC we use various tools(based on the analysis we have done) to improve and control the process in consideration.
In Short, SPC is the application of statistical methods to monitor and control a process to ensure that it operates at its full potential to produce conforming products.
Key Pointers
- Walter A Shewart is often referred to as Father of SPC.
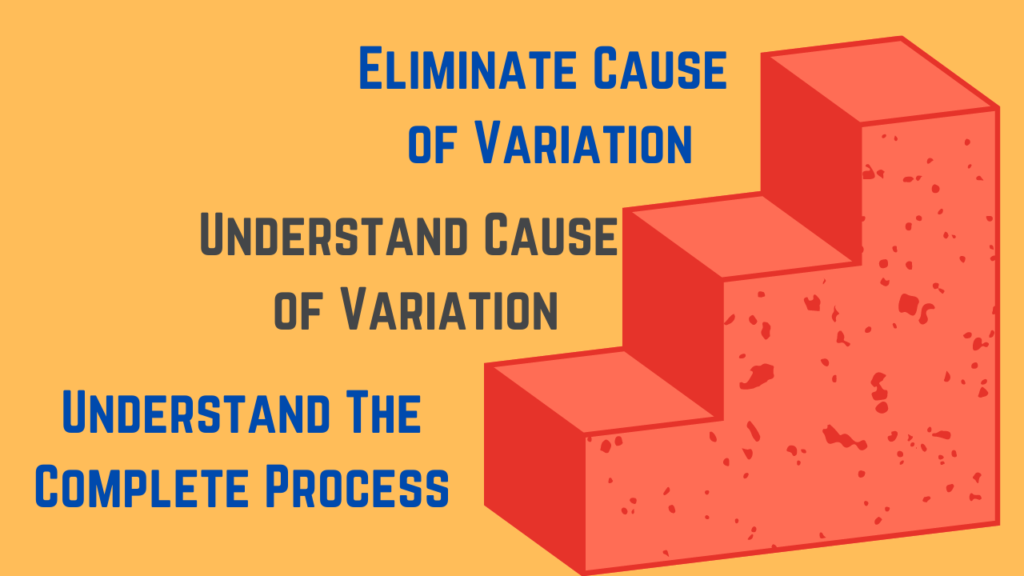
- Statistical Process Control can be broadly broken in three parts i.e. Understanding the Process,understanding the cause of Variation,Elimination of source of special cause of variation.
- SPC is a live monitoring system based on proactive approach
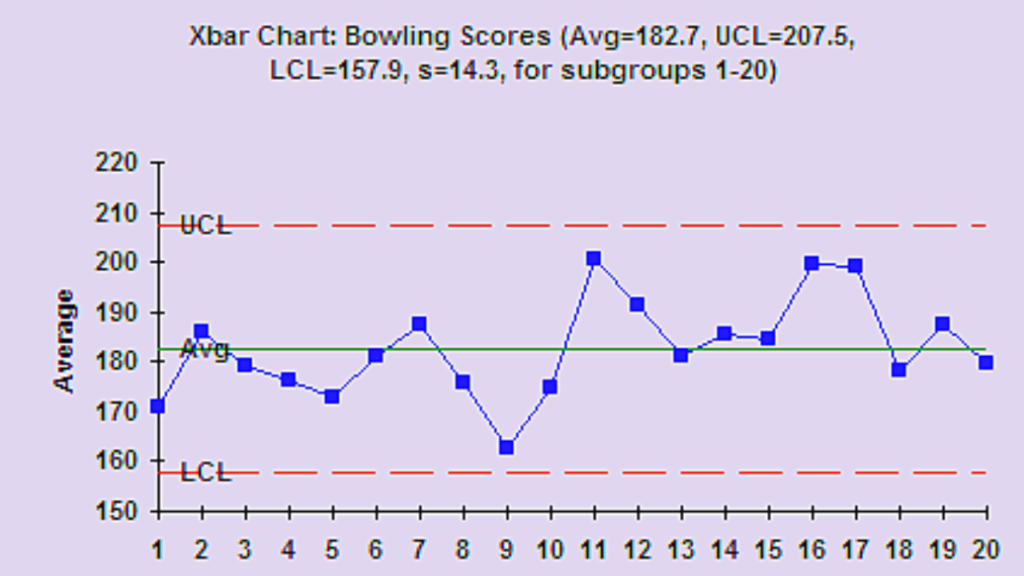
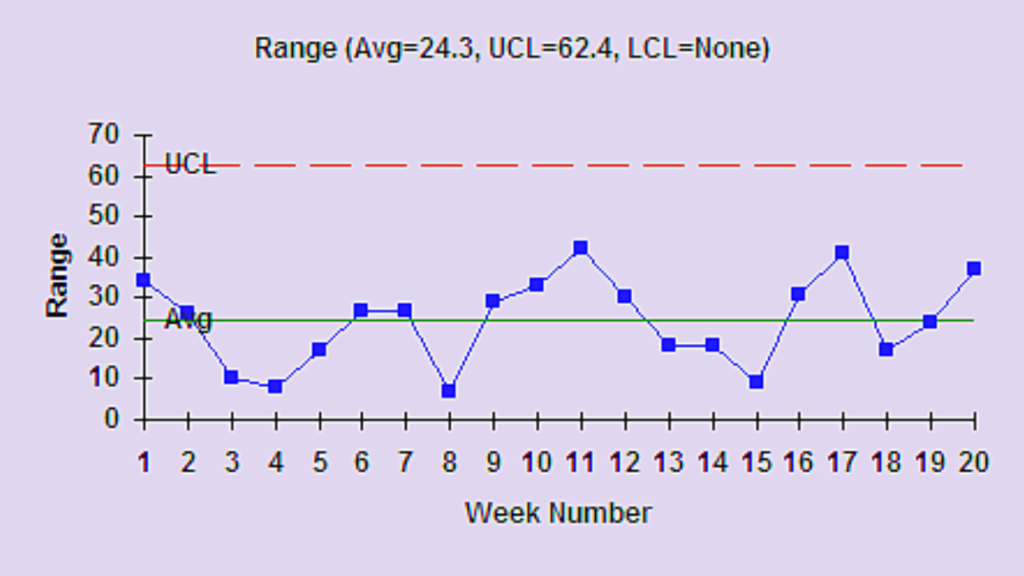
- Xbar and Range charts are the most commonly used types of Control Charts.
- Process capability analysis is conducted once the process is in stable condition i.e. no special cause of variation in the Process.

History of Statistical Process Control(SPC)
The origin of Statistical process control goes back to the 1920s when Walter A Shewhart developed the control chart and the concept that a process could be in statistical control in 1924 while working at Bell Telephone Laboratories, USA.
In the 2nd World war, concept Control charts were used extensively by the USA military to control the quality of munitions and other important products.
W.Edwards Deming, who is considered to be a student of Walter A Stewarts, helped spread concepts of SPC in Japan, post 2nd World war.
Nowadays concepts of SPC are widely used globally but in different types of industries. Concepts such as six sigma have helped the adoption of SPC at a much quicker pace.
Why use Statistical Process Control(SPC)?
Globalization has been a great opportunity for manufacturers but at the same time, it has led to an immense increase in competition and hence price war.
Production cost has multiple factors such as raw material, manpower, etc. The cost of the majority of these factors is generally not in the control of manufacturers.
So how does a manufacturer compete in such a situation? He has to control what he can control i.e. its processes.
SPC is an amazing tool that helps manufacturers evaluate their processes on a regular basis and make timely adjustments.
SPC helps manufacturers adopt a proactive approach. The SPC process is implemented to move a company from detection-based to prevention-based quality controls.
How to Perform Statistical Process Control?
SPC activities can be broken down into three activities

Understanding the Process
Mapping the Process
The process shall be broken into the smallest steps possible and depicted in the form of a Process flow diagram. Understanding the process helps in executing the next step.
Defining Key Characteristics
Monitoring all parameters will be a very lengthy, expensive, and impractical task, hence it’s important that we define(generally customer communicates key characteristics) key characteristics, those characteristics which contribute the most to the function or performance of the product in consideration.
Elements of the process which are generating the maximum waste can also be taken for implementing SPC tools to avoid waste.
Data Collection plan
SPC data is collected in the form of measurements of a product dimension/feature or process instrumentation readings. A data collection plan shall be made which incorporates what to be measured, when to be measured and how to be measured.
Validating Measurement system
All our results and actions based on those results are dependent on the accuracy of our data collection. If the quality of our data is not up to the mark, our measurements would be false and that indeed affects our decisions.
Hence using MSA(Measurement System Analysis) to validate our measurement system is of high importance
Understanding the cause of Variation
There are two kinds of variation in all kinds of the manufacturing process
- Natural or Common cause Variation
Common Cause variation is the variation that is inherent in the process and depicts stable process conditions. Variation due to factors such as ambient temperature and pressures, variation in material composition within the specified tolerance, etc are considered as common cause variation.
- Special cause Variation or Assignable Cause Variation
Special cause variations are not inherent to the process and occur due to some special causes. Causes such as Incorrect setup parameters, Wrong material grade are some of the special causes.
Based on his work, Walter A Shewhart concluded that every process displays variation. Some processes display controlled variation i.e. common cause variation and other display uncontrolled variation i.e. due to special factors.
Target is to use SPC tools to eliminate special causes and bring processes in a stable or controlled state.
Data Collection
SPC data is collected in the form of measurement of the key characteristics. Data collected is monitored on the various types of control charts. Control charts used depend upon the type of data.
Quantitative data can be divided into two types :
- Continuous Data: Continuous data is quantitative data that can be measured. It has an infinite number of possible values within a selected range. For example, If the tolerance of a parameter is 10 +-0.1, you can have infinite output options.It could be 10.01,10.011,10.022…..etc. It further can be classified into two categories :
- Interval: – Measured/scaled data: Each position equidistant – 0 can be relevant (temperature)
- Ratio: – Numbers compared as multiples of one another
- Discrete Date: Discrete Data can only take certain values.Example: The number of students in a class. We can’t have half a student! It further can be classified into two categories :
- Nominal: – Literally, “name” – Represents categories
- Ordinal: – Ordered or ranked data – Not scaled
There are multiple types of control charts but XBar and R Charts are the most commonly used control throughout the industry.
When the process is stable and does not trigger any of the detection rules for a control chart, a process capability analysis may be performed to predict the ability of the current process to produce conforming parts in the future.
When excessive variation is identified by the control chart detection rules, or the process capability is not up to the mark, effort shall be made to define the cause of the variation.
Following are the rules those can be used for proper interpretation of the control charts:
- Rule 1 – One point beyond the 3 σ control limit
- Rule 2 – Eight or more points on one side of the centerline without crossing
- Rule 3 – Four out of five points in zone B or beyond
- Rule 4 – Six points or more in a row steadily increasing or decreasing
- Rule 5 – Two out of three points in zone A
- Rule 6 – 14 points in a row alternating up and down
- Rule 7 – Any noticeable/predictable pattern, cycle, or trend
Following tools can be used in multiple combinations to find out the cause of variation:
- Cause-and-effect diagram (also called Ishikawa diagram or fishbone diagram)
- Check sheet(Data Collection Tools)
- Control chart(Data Collection Tools)
- Histogram
- Pareto chart
- Scatter diagram
- Stratification
Elimination of the special cause of Variation
Once the cause of variation has been identified, efforts shall be made to eliminate those causes that are practically and statistically significant.
Elimination of the cause of variation may include but not be restricted to
- Process or Product Design Change
- Implementation of Error Proofing or Poka yoke
- Standardization of work.
How to use Control Charts?


Control Charts have four key Characteristics
- Data Points :Either averages of subgroup measurements or individual measurements plotted on the x/y axis and joined by a line.Time is always on the x Axis.
- The Average or Center Line : The Average or the mean of the data points and is drawn across the middle section of the graph.
- The Upper Control Limit : It is drawn above the centerline and annotated as “UCL”.This is often called the “+3 sigma” line.
- The Lower Control Limit : It is drawn below the centerline and annotated as “LCL”.This is often called the “-3 sigma” line.
Basic steps for using Control charts are as follows
- A. Choose the appropriate control chart for your data.
- B. Determine the appropriate time period for collecting and plotting data.
- C. Collect data, construct your chart and analyze the data.
- D. Look for “out-of-control signals” on the control chart. When one is identified, mark it on the chart and investigate the cause. Document how you investigated, what you learned, the cause and how it was corrected.
Process Capability Study
If the process is in stable condition i.e. special cause of variation is not available in the process, Process capability analysis is conducted to ensure if the process will perform as per expectation in mass production.
At this stage we calculate Cpk and if it is more than 1.67 processes are considered to be capable of performing in mass production.
What are the benefits of SPC?
- It helps reduce waste.
- SPC reduces the time to produce the product or the service.Since it diminishes the likelihood that the final product will have to be reworked.
- It helps identify bottlenecks,wait time and other sources of delay within the process.
- Helps in cost reduction.Since it helps eliminate sources of wastes and improves productivity.
- Increases customer satisfaction,since the customer receives timely delivery of quality products.
- One major advantage of SPC is that it focuses on early detection and prevention of the problems in our processes.
FAQ

- Does SPC help improve performance?
SPC does not help improve performance directly, but it helps track special causes of variation and alarms for timely corrections in the process to eliminate such special causes of variation.
- Is there any softwares for SPC implementation?
Yes, the market is flooded with SPC software. Some of the examples are ProFicient, MQ1, Apriso Quality solution, Bluestreak, etc.
- How to plot control chart in Excel?
Refer to this link https://best-excel-tutorial.com/56-charts/371-statistical-process-control-chart
- What is the formula for UCL and LCL?
UCL = Mean + 3 Standard Deviation
LCL = Mean – 3 Standard Deviation
- Can a process be capable and out of control?
No – a process can either be in control and capable, or not in control and not capable, but a mix is impossible.
- What to do if a process is out of statistical control?
If the process is out of statistical control, it means there are special causes of variation. The target shall be to eliminate those special causes of variation and make the process more stable.
Resources
Image Source: www.freepik.com
www.quality-one.com
winspc.com
sixsigmastudyguide.com
www.isixsigma.com


