
Table of Contents
Definition
Process capability analysis is a statistical study or measurement of a process to evaluate if that process can consistently produce parts that meet customer specifications.
A Process can be defined as a series of operations or steps that converts a set of inputs into the desired output. Each process has some variations. Process Capability study helps predict if Process will perform such that variation is within specified limits.
It’s like a driving test on a test track. The motor department is predicting, based on your driving on the track, whether you would be able to drive a car on the road without supervision.
Spc for critical parameters is a general requirement that customers put forward during PPAP.

Key Pointers
- Process capability study shall be conducted only on stable processes.
- Process Capability represents the best performance of the process itself,whereas Process Performance represents the actual performance of the process.
- Cpk or Ppk takes in consideration Process centering whereas Cp or Pp does not.
- If the Cp = Cpk that means process is centered.
- If the Cp is much greater than Cpk that means process centering needs improvement.
- If the Cpk > Ppk that means a special cause of variation exists in the process.
- Cp is always greater than Cpk.
Why do we need Process Capability Analysis?
Imagine you book a car and the manufacturer says that we will try and build an operational car but we are not sure if it would work or not. Would you buy a car from such Carmaker? Certainly, I would not.
So Process capability analysis or Study helps producers predict the performance of their product against specified requirements and hence indeed helps instill confidence in consumers about product quality.
Following two are the expectations we have from our manufacturing process :
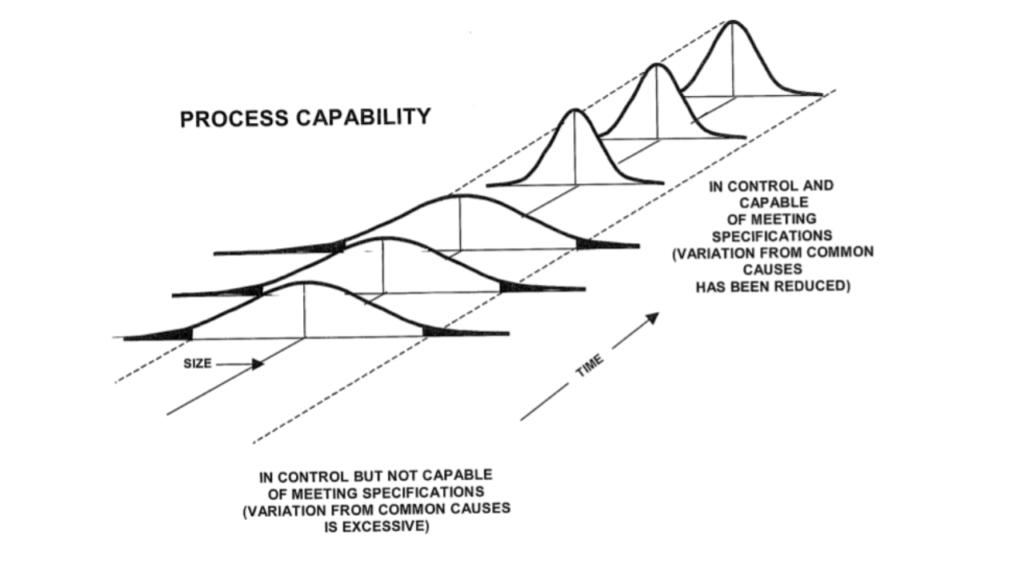
(1) It Should be centered over the Nominal desired by the design engineer, and
(2) It has a spread narrower than the specification width.
Process capability analysis helps us gauge if these two expectations are fulfilled or not.
If the process capability is not as per requirement, chances are that Not Good parts might be accepted as Good parts.
Monitoring process capability allows the manufacturing process performance to be evaluated and adjusted as needed to assure products meet the design or customer’s requirements
When to use Process Capability Analysis?
- To indicate the degree to which the product meets the customer specification.
- It can be used to make comparisons with other processes or competitors.
- To make comparison of before and after process,once process improvements are done.
What are the assumptions for Process Capability Analysis ?
- The Engineering specifications represent customer requirements.
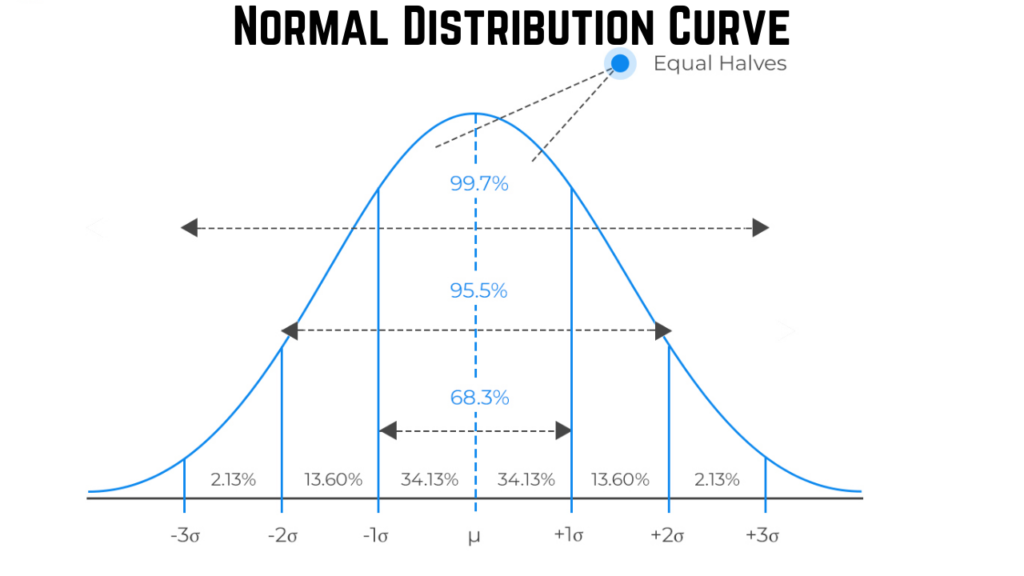
- The measurement data from the process conforms to normal distribution.
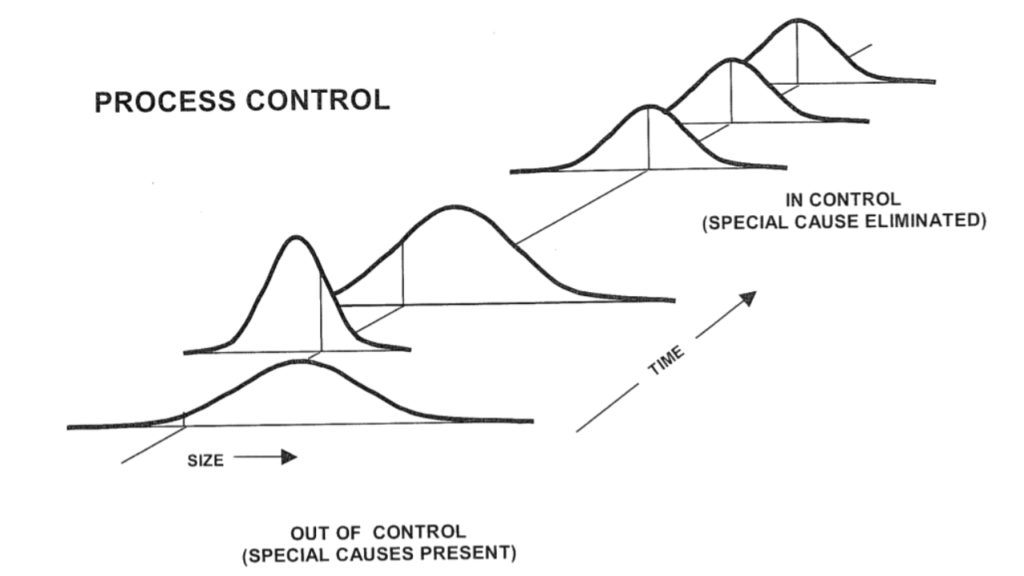
- Process is stable and does not have any special cause of variation.
- Measurement System is validated through MSA,hence measurement variation is within acceptable limits.
What is Cp,Cpk,Pp,Ppk?
When discussing process capability, two somewhat contrasting concepts need to be considered:
- Process Capability
- Process Performance
Process capability is determined by the variation that comes from common Causes. It Generally represents the best performance of the process itself. This is demonstrated when performance is being operated in a state of statistical control regardless of the specifications.
Customers(internal or external), are however more typically concerned with the process performance, that is, the overall output of the process and how it relates to their requirements, irrespective of the variations.
Let us understand the components of Process Capability and Process Performance.
Cp = Potential Process Capability
Cpk = Process Capability index
Pp = Potential Process Performance
Ppk = Process Performance Index
Cp is a type of capability index. It compares the process capability to the maximum allowable variation as indicated by the tolerance. Cp is not impacted by process location i.e. it does not establish any relationship with the center of Data.
Cpk is a type of capability index. It takes the process location as well as the capability into account.
Process Capability is the measure of the inherent capability of the process to be able to consistently produce parts that meet the design specifications.
Pp is a type of Performance index. It compares the process performance to the maximum allowable variation as indicated by the tolerance. Pp is not impacted by process location.
Ppk is a type of Performance index. It takes the process location as well as the performance into account.
Process Performance indices are the measure of performance of the process to be able to consistently produce components that meet the required specification. Process performance includes variation due to special causes whereas Process Capability does not include variation due to special causes.
In nutshell, the intent of the capability index, Cpk, is to determine whether or not a process is capable of meeting customer requirements. On the other hand Performance Index,Ppk shows whether or not the process is actually meeting customer-specific requirements.
How to calculate Cp,Pp?
Cp, Pp compares specification range (tolerance)to process width regardless of where the process is centered.
It is the ratio of the specification width to 6 x process standard deviation.
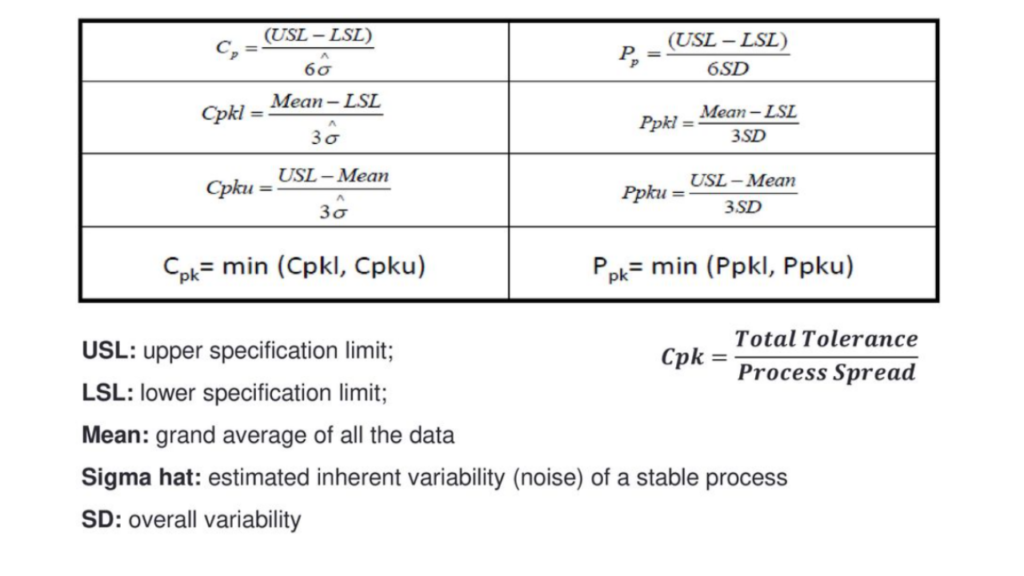
How to calculate Cpk,Ppk?
Cpk, Ppk measure how close the process center is to the nearest customer specification.
It is (difference between the process average and the nearest specification)/(3 x the process standard deviation).
Refer the last paragraph.
What are the differences between Process capability and Process performance?
Following are the major differences between Process Capability and Process Performance
- Calculation wise the major difference in Process capability and Process performance analysis is the method of checking standard deviation.
For Process Capability, the 6-sigma range is the range of inherent process variation, for statistically stable processes only, where the standard deviation is estimated by Rbar/d2 or Sbar/C4. It is also called a short-term standard deviation.
For Process performance, the 6-sigma range is the range of total process variation, where the standard deviation is estimated by the following formula. It is also called Long term standard deviation.
- Process performance includes variation due to special causes whereas Process Capability does not include variation due to special causes.
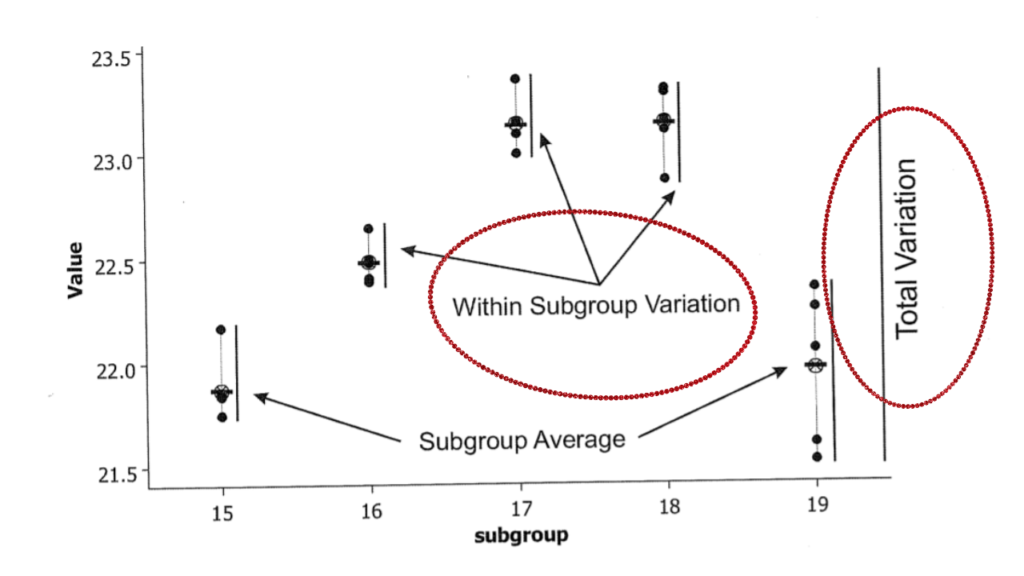
- Process Capability accounts for only within subgroup variation,whereas Process performance accounts for total process variation i.e. Both Within Subgroup and Between Subgroup Variation.
What does Cp,Cpk,Ppk,Pp tell us?
If the Cp = Cpk that means the process is centered
If the Cp is much greater than Cpk that means process centering needs improvement.
If the Cpk > Ppk that means a special cause of variation exists in the process.
FAQ
What is the accepted Value of Cp and Cpk?
Higher the value of Cp and Cpk the better it is. Generally, Cpk of less than 1 indicates that the process is not capable and Cpk between 1 to 1.33 indicates the process to be barely capable and Cpk>1.33 indicates that the process is capable.
How do we Know that Process is Stable?
We can conclude whether or not the process is stable using control charts. The stable process does not depict any special cause variation. If Control Charts does not possess any of the following conditions, Process is considered to be in a stable state.
- Rule 1 – One point beyond the 3 σ control limit
- Rule 2 – Eight or more points on one side of the centerline without crossing
- Rule 3 – Four out of five points in zone B or beyond
- Rule 4 – Six points or more in a row steadily increasing or decreasing
- Rule 5 – Two out of three points in zone A
- Rule 6 – 14 points in a row alternating up and down
- Rule 7 – Any noticeable/predictable pattern, cycle, or trend
What is the Cpm Index and How is it different from Cp,Cpk,Pp and Ppk ?
The Cpm index, often associated with Taguchi’s Loss Function, was developed as an alternate way to account for the effect of process centering on estimates of process capability or Process performance. Cpk and Ppk focus on process mean and not the specification target and Cpm focus on the specification target.
For example
Nominal Value = 10
USL = 11
LSL = 9
Mean of 125 Samples measured = 10.1
For sigma or standard deviation calculation in the Cpm Nominal value of 10 will be used not the mean value of 10.1.
What is the thumb rule for calculating sigma level using Cpk value?
Multiply Cpk value with 3 to derive approx the sigma level of the process.
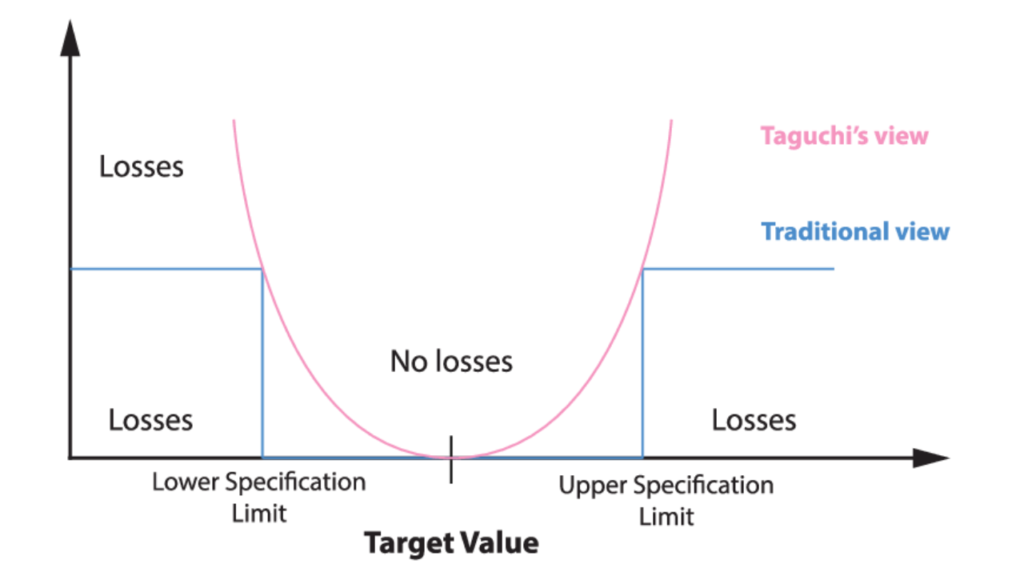
What is Taguchi’s Loss Function?
Taguchi Loss Function was developed by Genichi Taguchi. It is the graphical representation of how the increase in variation within specification limits leads to an exponential increase in Customer Dis-satisfaction.
For example, if the lower limit is 9, and the upper limit is 11, then a measurement of 10.9 will lead to customer satisfaction, while a measurement of 11.1 will lead to customer dissatisfaction. Moreover, a measurement of 10.8 will lead to more customer satisfaction, as compared to a measurement of 10.9, although both are within the specification band.
Resources
quality-one.com
www.isixsigma.com
www.leansixsigmadefinition.com
1factory.com