What is an interrelationship diagram? This is a question that many people don’t know the answer to.
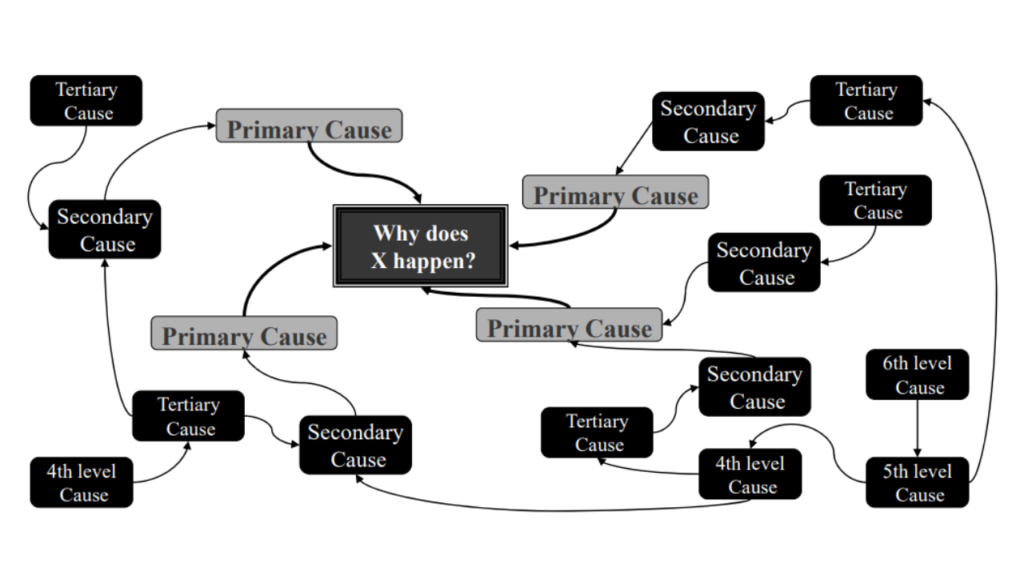
An interrelationship diagram is a specialized type of relationship diagram that shows how different parts of a system are related to one another. It can be helpful for understanding the complex interactions between different parts of a system.
These are used for Finding Solutions Strategies by Clarifying Relationships with Complex Interrelated Causes. To allow a team to systematically identify, analyze, and classify the cause and effect relationships that exist among all critical issues.
The interrelationship diagram is one of the new 7 QC tools. Other six being
- Affinity Diagram
- Tree Diagram
- Matrix Diagram
- Arrows Diagram
- Process Decision Program Chart
- Prioritization Matrix- Matrix Data Analysis
Table of Contents
When should you use an interrelationship diagram?
There are many different situations when an interrelationship diagram can be helpful. Some examples include:
- When you need to understand the complex interactions between different parts of a system.
- When you need to find solutions to problems with many interconnected causes.
- When you need to communicate the relationships between different entities in a clear and concise way.
What are the benefits of using an interrelationship diagram?
There are many benefits to using an interrelationship diagram. Some of these benefits include:
- They can help you to understand complex systems.
- They can help you to find solutions to problems with many interconnected causes.
- They can help you to communicate the relationships between different entities in a clear and concise way.
- Useful at the planning stage for obtaining perspective on the overall situation.
- Facilitates consensus among team
- Assists to develop and change people’s thinking
- Enables priorities to be identified accurately
How to make an Interrelationship diagram?

Steps for making an Interrelationship diagram are as follows :
Step #1
Express the problem in form of “Why isn’t something happening?”
Step #2
Each member lists 5 causes affecting the problem.
Step #3
Discuss info collected until everyone understands it thoroughly
Step #4
Write each item on a card
Step #5
Move cards into similar groups
Step #6
Asking why, explore the cause-effect relationships, and divide the cards into primary, secondary, and tertiary causes
Step #7
Connect all cards through these relationships
Step #8
Further, discuss until all possible causes have been identified
Step #9
Review the whole diagram looking for relationships among causes
Step #10
Connect all related groups
What are some tips for creating an interrelationship diagram?
If you need to create an interrelationship diagram, there are a few things that you should keep in mind. These tips will help you to create a well-designed and effective diagram:
- Keep it simple – don’t try to show too much information in your diagram.
- Make sure that the relationships between different entities are clear.
- Use colors and labels to help communicate important information.
- Take your time – creating a good interrelationship diagram can take some time and effort.
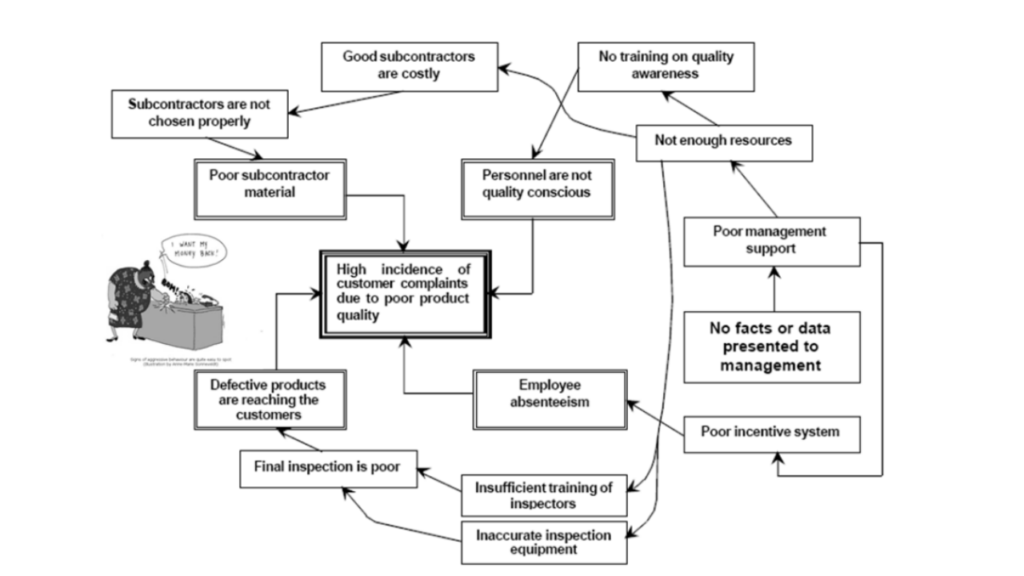
Example of Interrelationship Diagram


