
Table of Contents
What is Tree Diagram?
A tree diagram is a visualization tool that can be used to show the hierarchical relationship between items. It can be used in new management tools to help visualize the relationship between items and to help with decision-making.
Tree diagrams can be used to show the relationships between items in a project, or between different parts of a company. For example, a tree diagram can be used to show the relationship between departments in a company, or the different steps in a project.
A tree diagram can be very helpful in decision-making, as it can show the different options and the possible outcomes of each option. This can help to make sure that all options are considered, and that the best decision is made.
The Tree diagram is one of the new 7 QC tools. Other six being
- Affinity Diagram
- Interrelationship Diagram
- Matrix Diagram
- Arrows Diagram
- Process Decision Program Chart
- Prioritization Matrix- Matrix Data Analysis
When to use Tree diagram in new management tools?
- When weighing the pros and cons of several possible options
- After a key issue has been identified using an affinity diagram or an interrelationship diagram
- To clarify things to others as a communication mechanism
- When you need to move from broad generalities to particular details about a topic, such as when formulating logical procedures to reach an aim.
- When it comes to putting a solution or other strategy into action.
- When delving into the details of a process.
- When you’re looking for the source of a problem.
- To clarify things to others as a communication mechanism
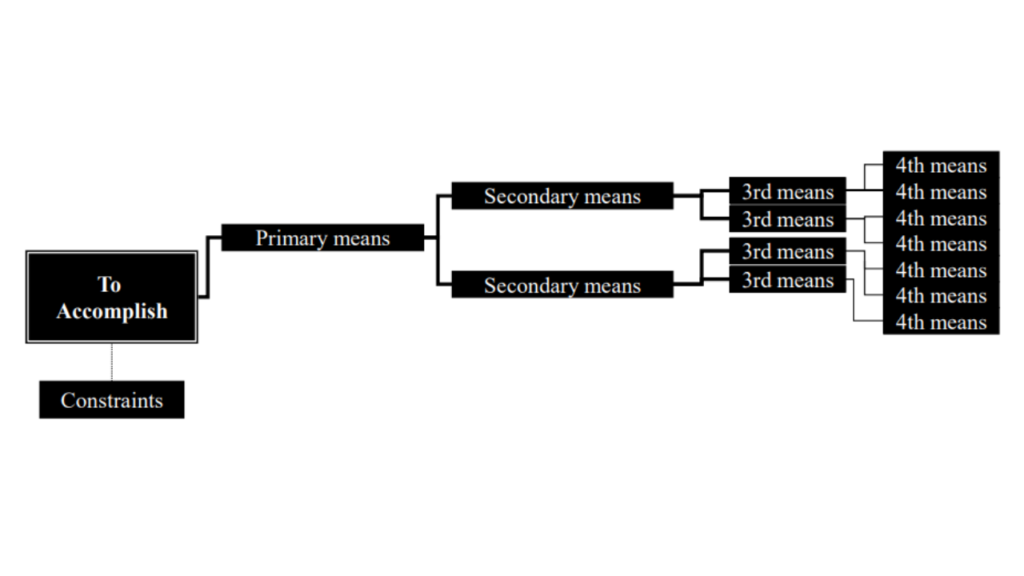
What are the components of a tree diagram?
The components of a tree diagram are:
- The root node, which is at the top of the diagram and represents the main topic or issue.
- The branches, connect the nodes and represent the subordinate topics or issues.
- The leaves, are the endpoints of the branches and represent the specific details.
How do you make a tree diagram?
Tree diagrams can be created using software such as Microsoft Visio, or they can be drawn by hand.
Steps for Constructing a Tree Diagram
Step #1
Decide Relations Diagram topic (Objective card). Write it at the top (for a vertical tree) or far left (for a horizontal tree) of your work surface.
Step #2
Identify constraints on how objectives can be achieved.
Step #3
Discuss means of achieving the objective (primary means, first level strategy)
To do so ask a follow-up question to go to the next level of detail. Consider the following scenario:
“What tasks must be done to accomplish this?” or “How can this be accomplished?” is a good question to ask for a goal, action plan, or work breakdown structure.
“What causes this?” or “Why does this happen?” are good questions to ask for root-cause analysis.
“What are the components?” is a good question to ask while looking at a Gozinto chart. (The word “gozinto” is derived from the question “What goes into it?”)
Step #4
Take each primary mean, write the objective for achieving it (secondary means)
Each of the new idea statements now becomes the subject: a goal, objective, or problem statement. For each one, ask the question again to uncover the next level of detail.
Step #5
Continue to expand to the fourth level or do not stop until you reach fundamental elements: specific actions that can be carried out, components that are not divisible, root causes.
Step #6
Review each system of means in both directions (from objective to means and means to objective)
Add more cards if needed
Step #7
Connect all levels
Example of Tree Diagram
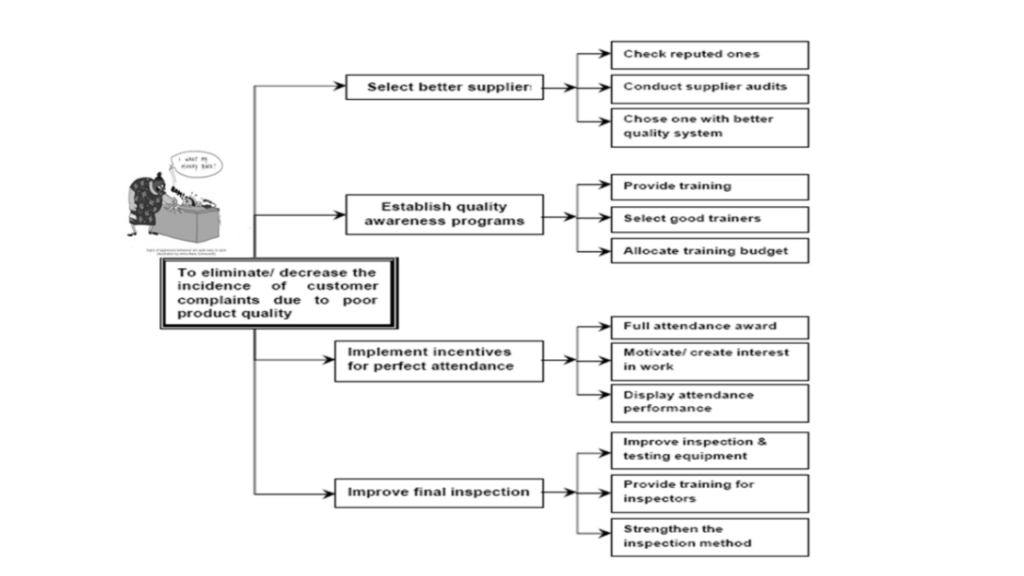
Complaints due to poor quality
Advantages and Disadvantages of Tree Diagram
Advantages
- Its a Systematic and logical approach hence it is less likely that items are omitted.
- Facilitates agreement among team members.
- Helps visualize the problem from a bird’s eye view.
- Develops a succession of strategies for achieving objectives.
- Reveals methods to achieve the results.
Dis-advantages
- Though simple to design, it can be perplexing with the entire graphical display of information.
- It can also be cumbersome with multiple branches after a certain point.
- It’s difficult to add additional branches in the middle since the complete structure must be moved to the lower levels of the tree.
Tree Diagram V/s Affinity Diagram
When it comes to visualizing information, there are two main types of diagrams: Tree diagrams and affinity diagrams.
- Tree diagrams are better for organizing hierarchies, while affinity diagrams are better for sorting and grouping items.
- The affinity diagram merely aids in the presentation of good ideas; nonetheless, taking action or implementing solutions necessitates more investigation. The tree diagram, on the other hand, gradually breaks down difficulties by partitioning larger problems into smaller ones. A tree diagram is a visual representation of the tasks and subtasks that must be completed in order to reach the project’s goal.
- Tree diagrams typically start with a single item at the top, which branches out into multiple items below it, each of which may branch out further in the same manner. Whereas affinity diagrams typically start with a large collection of items, which are then sorted and grouped together based on their similarities.
Both tree diagrams and affinity diagrams have their own strengths and weaknesses, so it’s important to choose the right one for the task at hand. If you need to show the hierarchy of items, a tree diagram is a way to go. If you need to sort and group items, an affinity diagram is a better choice.