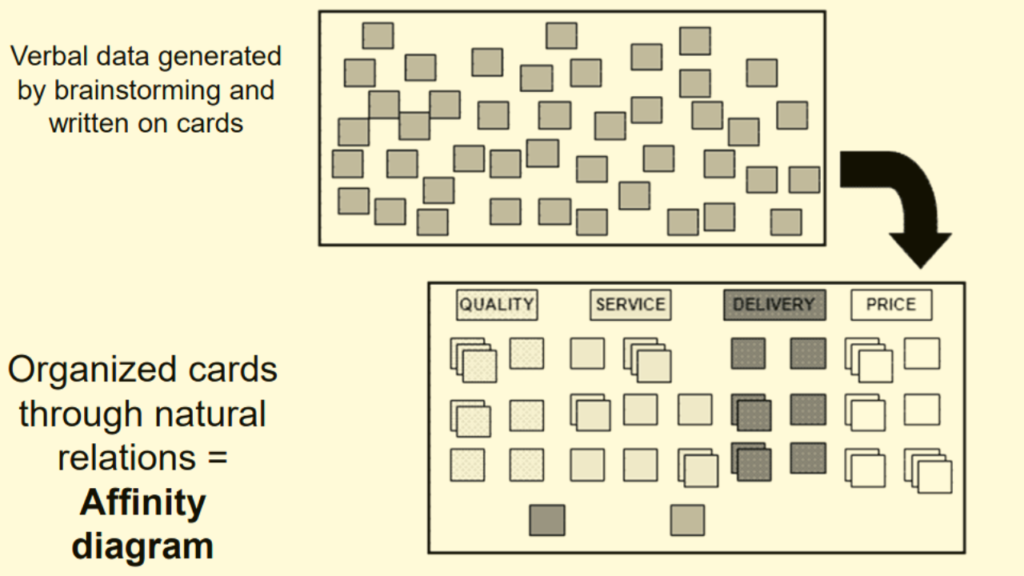
An affinity diagram is a tool used in Six Sigma and other quality control processes to help identify and group similar items. It can be used to organize data, ideas, or problems. The name “affinity diagram” comes from the idea that like items are drawn together or “affined.”
This tool was first developed in the 1970s by Dr. Kaoru Ishikawa and has been popularized in recent years by the new 7 QC tools introduced by the American Society for Quality.
Let’s take a closer look at what affinity diagrams are and how they can be used to improve your business!
Table of Contents
What is an affinity diagram?
An affinity diagram is a tool used in Six Sigma and other quality control processes to help identify and group similar items. It can be used to organize data, ideas, or problems. The name “affinity diagram” comes from the idea that like items are drawn together or “affined.”
This tool was first developed in the 1970s by Dr. Kaoru Ishikawa and has been popularized in recent years by the new seven QC tools introduced by the American Society for Quality.
An affinity diagram can be used to organize data, ideas, or problems. It is a tool that can help identify relationships between things that are not obvious at first glance. affinity diagrams are often used in brainstorming sessions to help groups generate ideas and find solutions to problems.

When should you use an affinity diagram?
Affinity diagrams can be used in a variety of different ways.
- They can be used to organize data, ideas, or problems.
- Affinity diagrams can also help identify relationships between things that are not obvious at first glance.
- Affinity diagrams are often used in brainstorming sessions to help groups organize ideas in logical buckets and find solutions to problems.
Typical situations where we use Affinity Diagram are as follows.
- Just after a brainstorming exercise, when you have lots of ideas but no visible pattern.
- When analyzing verbal data, such as survey results.
- When collecting and organizing complex data sets
- When developing logical relationships among ideas
- New product development
- Process improvement
- Quality control
- Market research
- Customer satisfaction
Once you have all of the data grouped together, you can start to look for patterns and relationships between the groups. This can help you to identify themes or categories.
When Should You Avoid It
An affinity diagram as described above is best suited to specific areas and should be avoided under certain conditions.
- When the data sets available are small in number (less than 15) the affinity diagram can be skipped.
- There is no significant benefit that can be gained by creating the affinity diagram as the data is neither large enough to become cumbersome nor too disorganized to confuse thought. Creating an affinity diagram under such circumstances may just be an exercise in futility.
How to create an affinity diagram?
There are a few different methods you can use to create an affinity diagram. The most important part is to get all of the data or ideas down on paper (or in a digital document) so that you can start sorting and grouping them.
The steps for making Affinity Diagram are as follows:
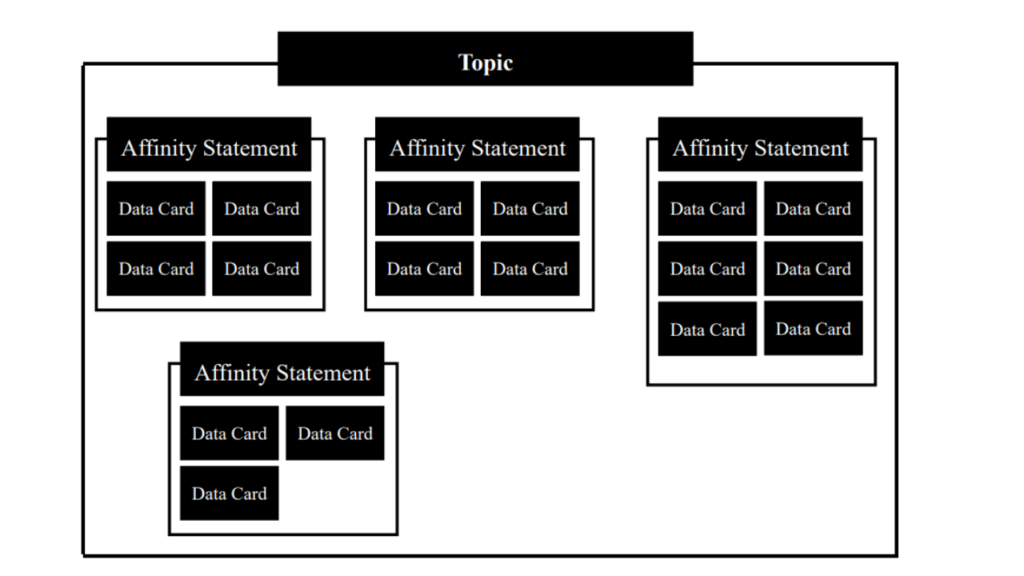
- Step #1: Select the topic to be analyzed
- Step #2: Use brainstorming to collect verbal data and ideas
- Step #3: Write each item on the separate data card
- Step #4: Spread out all cards on the table or stick them on a board
- Step #5: Move data cards into groups of similar themes (natural affinity for each other)
- Step #6: Combine statements on data cards to new Affinity statement
- Step #7: Make a new card with the Affinity statement
- Step #8: Continue to combine until less than 5 groups
- Step #9: Draw the final Affinity Diagram for the problem discussed

Once you have all of the data grouped together, you can start to look for patterns and relationships between the groups. This can help you to identify themes or categories.
Affinity diagrams are a helpful tool that can be used in a variety of different ways. If you’re looking for a way to organize data, ideas, or problems, give affinity diagrams a try!
Use of Affinity diagram in six sigma
One of the most popular uses for affinity diagrams is in Six Sigma improvement projects. Six Sigma is a quality control methodology that seeks to reduce defects in any process. Part of the Six Sigma methodology involves brainstorming sessions, during which affinity diagrams can be used to capture all of the ideas generated by the team.
The affinity diagram is used in the Define phase of DMAIC. During the Define phase, you gather data and analyze it to identify the problem that needs to be solved. The affinity diagram can help you to organize and group the data so that you can better understand it.
The affinity diagram is also used in the Analyze phase of DMAIC. During the Analyze phase, you analyze the data to identify the causes of the problem. In analyze phase, the affinity diagram can be used to group data and find relationships between different items.
After the affinity diagram is completed, it will help in creating a cause and effect diagram which is used to identify the root cause of the problem.
Use of Affinity diagram in Project management
An affinity diagram is a graphic made up of a huge number of ideas or viewpoints that are organized into logical clusters by connecting similar or related concepts. It’s a project management approach that works well in brainstorming sessions to arrange thoughts. While working on an area with limited knowledge, the affinity diagram concept can be effectively utilized by teams in manual project planning.
Another common use for affinity diagrams is in new product development. When developing a new product, it is important to consider all of the potential features and benefits that it could offer. An affinity diagram can help you to organize and prioritize all of these ideas.
Benefits of using affinity diagrams
There are a few key benefits of using affinity diagrams:
– They help to organize data, ideas, or problems in a logical way.
– They can help to identify relationships between things that are not obvious at first glance.
– They are often used in brainstorming sessions to help groups organize ideas.
– They can be used in a variety of different ways, depending on the situation.
– They are popularly used in Six Sigma improvement projects.
– They can help to identify the root cause of a problem.
Drawbacks to affinity diagrams
There are a few drawbacks to affinity diagrams:
– They can be time-consuming to create.
– They can be difficult to use if there is a lot of data.
– They are not always effective in identifying the root cause of a problem.
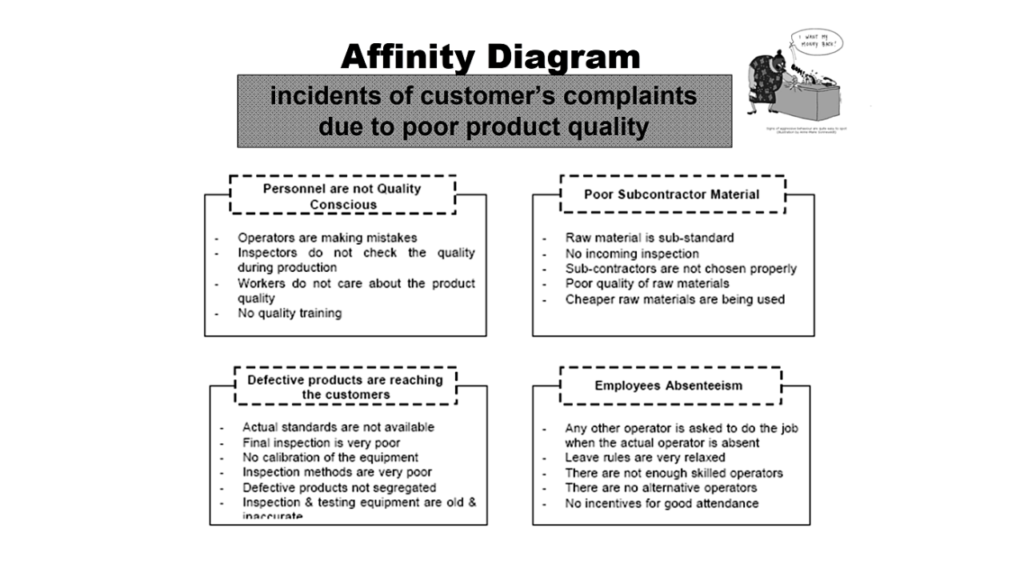
Affinity Diagram Examples
Example: Potential causes of incidents of customer complaints due to poor product quality.


